Microsoft Power BI is the fastest growing business intelligence tool in the world with standard Sage 200 connectors now available
Power BI is a business analytics service by Microsoft. It aims to provide interactive visualisations and business intelligence capabilities suitable for all user types.
Sage 200 has contained is own proprietary business intelligence module for several years, but with Microsoft Power BI for Sage 200 users can now leverage the power of their Sage 200 data using industry-leading Business Intelligence tools that are available to everyone.
Supporting businesses across the UK
Ideal for companies with:
-
Lots of Data in different places
-
Office 365 subscription
-
No requirement for data to be live
-
In house database and/or MS Excel skills


Key Software Features
-
Drill directly into your data
-
New connector to link Sage 200
-
Interactive visualisations and business intelligence capabilities
-
Publish reports and dashboards, collaborate with your team (subject to licensing level)
Sage has provided a connector, so it is now easier than ever to connect to your data, start analysing and create your own dashboards in Microsoft Power BI.
Power BI is a business analytics service by Microsoft. It aims to provide interactive visualisations and business intelligence capabilities with an interface simple enough for end-users, who are already familiar with Microsoft Excel tools such as Pivot Tables, to create their own reports and dashboards.
At PKF Smith Cooper Systems, we have been integrating Sage 200 SQL data with Power BI since its launch, but now Sage has provided a connector its easier than ever to connect to your data, start analysing and create your own dashboards.
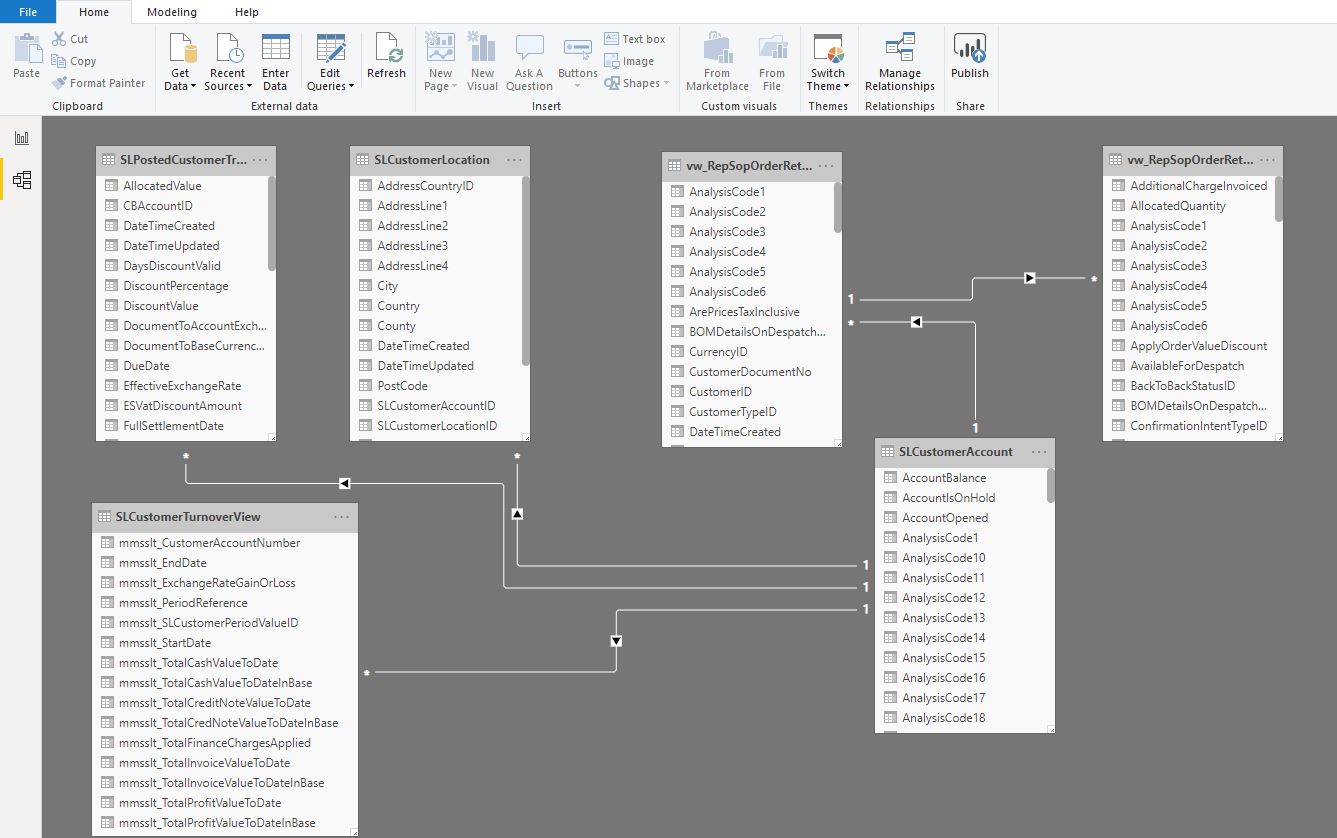
Power BI is connected to SQL and, in this example, we have pulled the customer account, address information, Customer Turnover and Sales Order tables direct from the Sage 200 database.
Once connected you can now start to utilise the tables to build your dashboard.
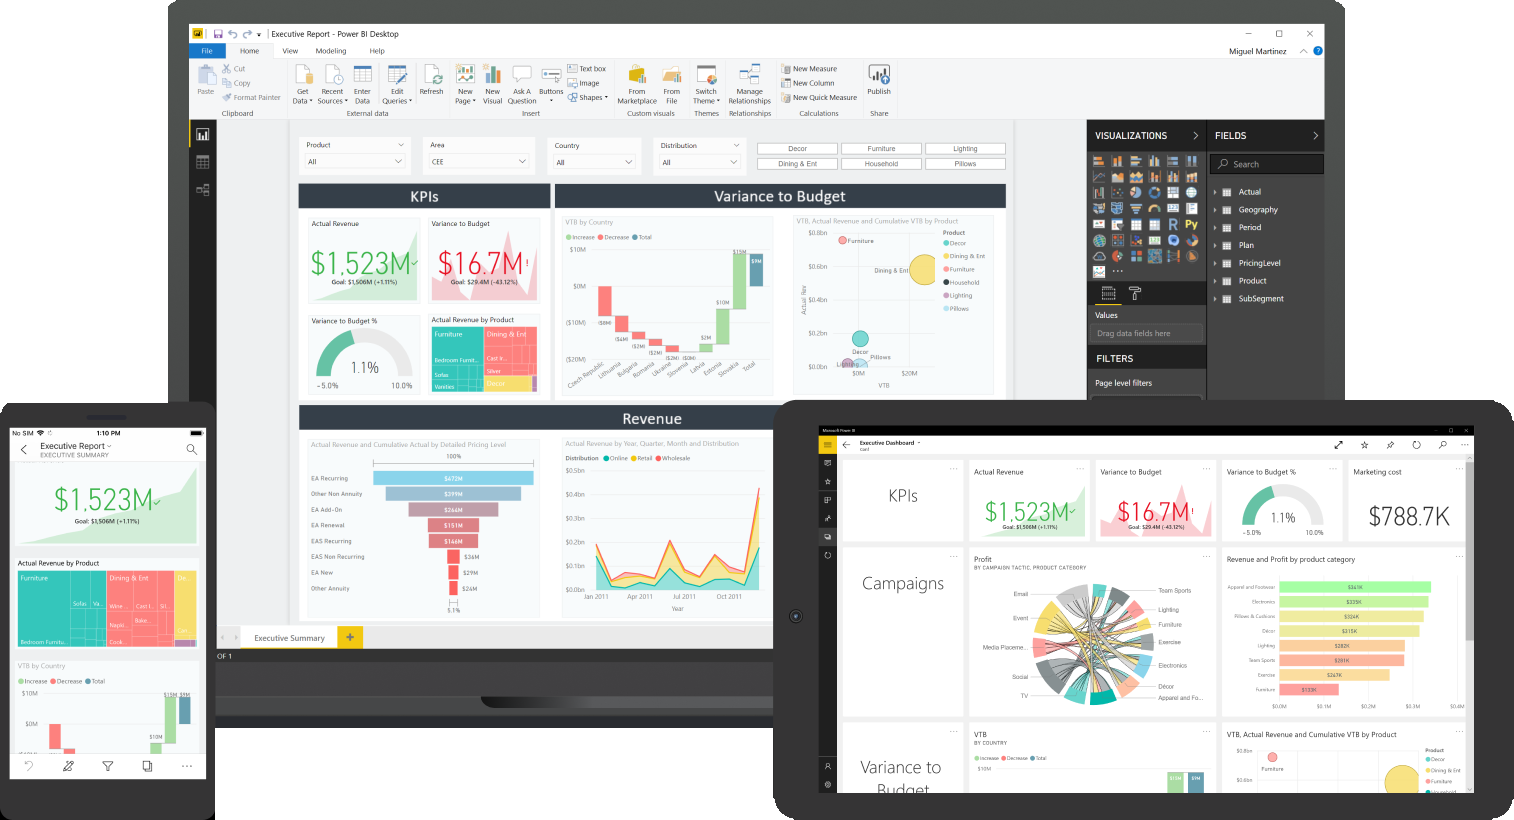
The dashboards themselves are made up of visualisations which can be tables, charts, maps or any other visual representation of data that can be downloaded from the Microsoft marketplace.
In the dashboard, below, the following data is displayed:
- Debtors showing a real-time breakdown of customer balances. This is from the customer accounts.
- Monthly turnover with a trend line showing the performance of the company over time across the customer base.
- Top Customers based on Turnover as a list.
- Top 10 customers based on Turnover as a pie chart.
- The geographic location of each customer based on their postcode.

What makes Power BI truly powerful is its ability to drill into data.
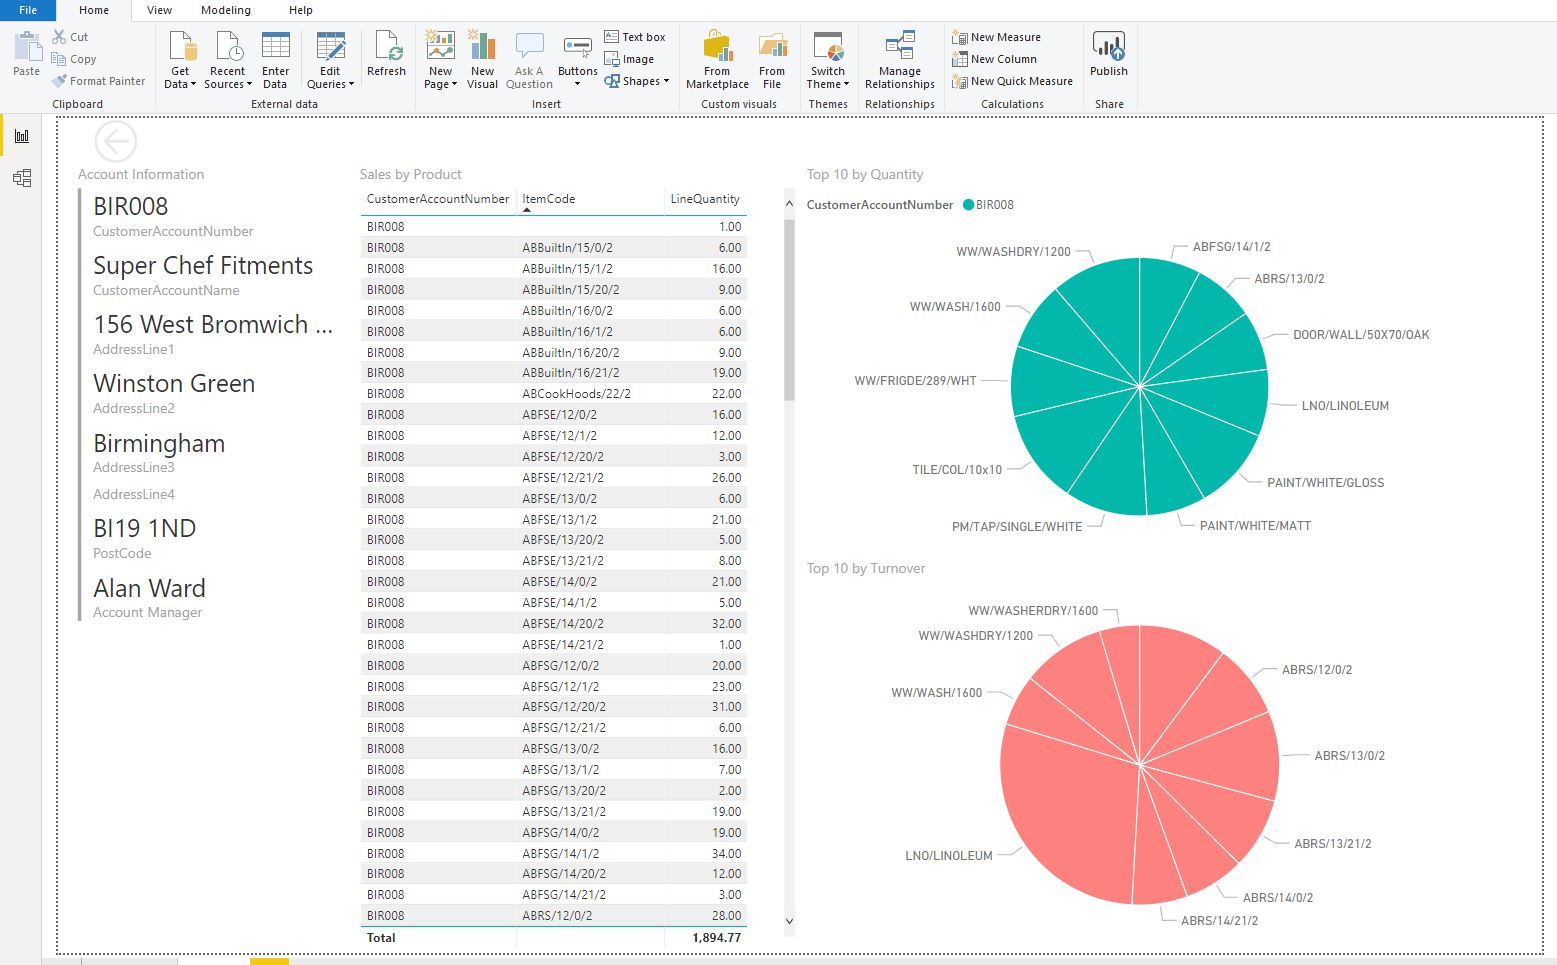
For example, if you want to see what is making up the black section of my pie chart you can right-click on it and select Drill through.
This opens up a whole new set of data, pre-filtered by your selection, where you can see the account information, sales by product as a list, Top 10 products based on Turnover and Quantity.
At any point, the user can drill back to the parent dashboard and interrogate another clients data.
If you would like to arrange an onsite demonstration of how Microsoft Power BI can work for you, an initial WebEx overview or would simply like to find out a little more, then do not hesitate to contact us via [email protected] or give us a call on 01332 959008
-
How do you disconnect a visualisation from page filters/slicer?
Click on the slicer and then under the tab Format, select Edit Interactions.
Turn off the interaction on the visual you don’t want the slicer to affect.
-
Adding a row manually to manually created table.
Contact us today to discuss your Business Intelligence options!
Call 01332 959008 or enquire online today
"*" indicates required fields