
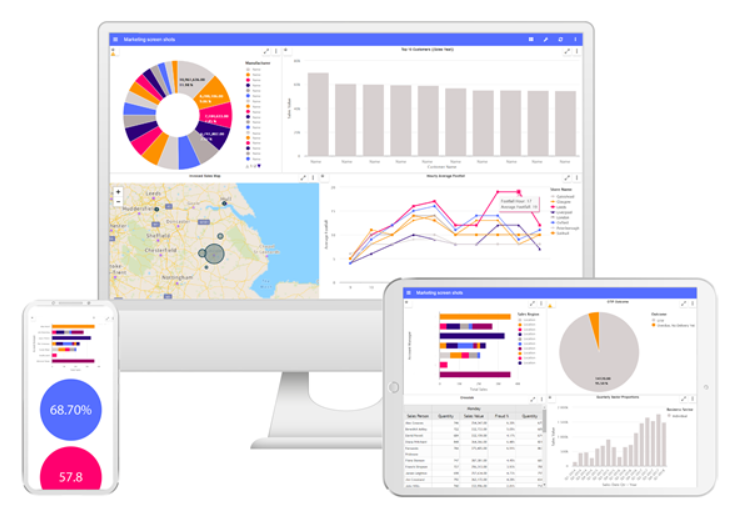
Panintelligence mobile dashboards plug straight into Sage 200, meaning that all the charts are live and always up to date.
Centralised reporting dashboards are essential for businesses who want to put their data to good use – collect it, analyse it, and trust it to make decisions
Panintelligence can take data from multiple sources – including Sage 200 and other databases – and view it side by side in the same dashboard.
The software can be accessed on any device and also includes carousel functionality for internal wallboards or TV’s
If your current reporting practices aren’t detailed enough, flexible enough, or are simply taking up too much resource, then its time to consider a business intelligence solution.
Supporting businesses across the UK
Ideal for companies with:
-
Multiple data sources and no central reporting tool
-
Dispersed team who need live data from Sage 200
-
Multiple offices, divisions or departments with their own KPI and reporting requirements


Key Software Features
-
Web-based dashboard available on any device
-
Pre-configured data connection to Sage 200
-
Easy to install, no additional hardware required
-
Real time data with drill down
-
Easy to build and filter charts with no developer knowledge
Panintelligence for Sage 200 provides a top-down view of all areas of your business, to both Sage users and non Sage users, allowing you to make proactive, timely and informed business decisions.
Business Intelligence for Sage
Panintelligence transforms reporting within Sage 200 Financials, Commercials, Manufacturing and CRM, leaving you and your staff armed with all your information in one place.
The dashboard is a browser-based internet application that allows users to quickly access real-time data and present it in a customisable and visually appealing dashboard.
Not only does the dashboard provide a simple, intuitive user interface, but it also requires little or no training for end-users, and is quick and easy to install.
Typically, when using Excel, the data you use is already out of date by the time you have been able to accurately report on it. But, as Panintelligence plugs straight into Sage 200, it means that all the data shown in the dashboard is live and always up to date.
Great features of Panintelligence for Sage 200
- Drilldown on charts and graphs to the underlying data
- Show data from Sage 200 and other sources side by side
- Easy to install, with no additional hardware required
- Connect to data with a simple and secure API
- Comes preconfigured with a data connection to Sage 200 and a library of charts
- Control what users can see and do with access rights and privileges
- Set KPI alerts to monitor key targets
- Create and edit charts with no technical skills required
- Access the dashboard on tablet and mobile
- Allows users to access real time Sage 200 data without needing a Sage license
If you need any support with your Sage200 system or any further information on any of the videos posted, then do not hesitate to contact us on 01332 959008 or email [email protected]
-
Can the dashboard content be tailored?
The dashboard charts and layouts can be updated without any technical training from us. This content can be altered as often as required to keep the dashboard relevant to your needs.
-
Are the dashboards visible and usable online?
Yes. All of the dashboards are web-enabled. A secure login can be provided over the web to you so you can share restricted content with third parties.
-
Can I connect my dashboard to multiple data sources?
Yes. You can combine data from multiple data sources, giving you a full view of all your company data on one dashboard.
-
Is a data warehouse necessary?
No. The Panintelligence dashboard connects directly to most SQL databases, these can be OLTP or Data Warehouses, or a mixture of both. No data is moved as part of our dashboard, and no data is stored locally on the client.
The user models their data dictionary in the dashboard which then uses this ‘data connection’ to connect to the underlying database(s).
However if the underlying OLTP database is especially complex, or if you are consolidating data from multiple disparate systems, or dealing with very large amounts of data (hundreds of millions of rows) then a Data Warehouse may be desirable.
-
Can I deploy the Panintelligence dashboard over the Internet as well as locally on our own internal network?
Yes. Indeed this is one of the most popular ways to deploy the dashboard, enabling our clients to share data not only with remote workers but also with their partners, customers and suppliers. Charts can be dynamically filtered by user logon, so the user will only see data that refers to them, without the need to built separate charts for each user.
-
Can I use my corporate branding on the dashboards?
Yes. You can change the default colours via a style sheet to match your corporate branding and you can even display multiple logos driven by the user logon, for example.
Contact us today to discuss your Business Intelligence options!
Call 01332 959008 or enquire online today
"*" indicates required fields